Salad topper protein packed vs Demae Ramen Tonkotsu Flavor
Wondering which one to pick? We analyzed the nutritional profile, ingredients, and vegan status to help you decide.
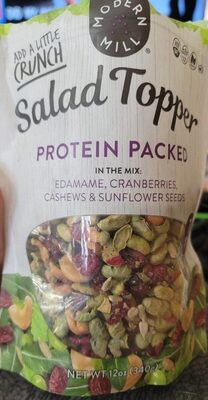
Salad topper protein packed
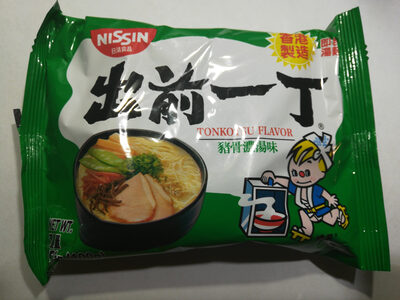
Demae Ramen Tonkotsu Flavor
The Verdict: Which is Better?
When placing Salad topper protein packed and Demae Ramen Tonkotsu Flavor side-by-side, the nutritional differences become quite clear. Both products cater to specific dietary needs, but picking the right one depends on whether you are prioritizing weight loss, muscle gain, or clean eating.
Salad topper protein packed is the more energy-dense option here, packing 17 more calories per 100g than Demae Ramen Tonkotsu Flavor. If you are looking for sustained energy or fueling a workout, this higher caloric density might be an advantage.
However, watch out for the sugar content. Salad topper protein packed contains significantly more sugar (26.7g) compared to the milder Demae Ramen Tonkotsu Flavor (3g). If you are monitoring your insulin levels or trying to cut down on sweets, Demae Ramen Tonkotsu Flavor is undeniably the healthier pick.
Looking to build muscle? Salad topper protein packed offers a protein boost with 23.3g per 100g, outperforming Demae Ramen Tonkotsu Flavor in this category.
Frequently Asked Questions
Which is healthier: Salad topper protein packed or Demae Ramen Tonkotsu Flavor?
It depends on your goals. Salad topper protein packed has 467 calories, while Demae Ramen Tonkotsu Flavor has 450 calories. Check the detailed table above for sugar and fat content.
Is Salad topper protein packed vegan?
No, Salad topper protein packed is not certified vegan.
What is the calorie difference between Salad topper protein packed and Demae Ramen Tonkotsu Flavor?
There is a difference of 17 calories per 100g between the two products.